Wayne Wile, Numbers That Mean Whatever You Want

Yesterday, we got the PMI survey data for U.S. manufacturing in the month of May and the overall index was slightly above 50, which indicates expansion. So, of course, the headline readers were re-assured that the U.S. is not in recession. Right? Nope.

First, here’s the data:

PMI Manufacturing Index Flash

Released On 5/23/2016 9:45:00 AM For May, 2016:

Consensus: 50.8

Consensus Range: 50.5 to 51.5 

Actual: 50.5

And here is the chart for the Index showing that it is just above contraction:

markit

The PMI Index includes all sorts of data about future expectations and other kinds of hopium, rhymes with opium.

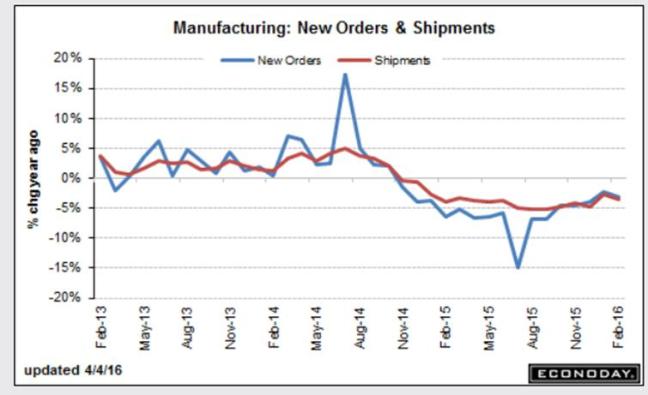
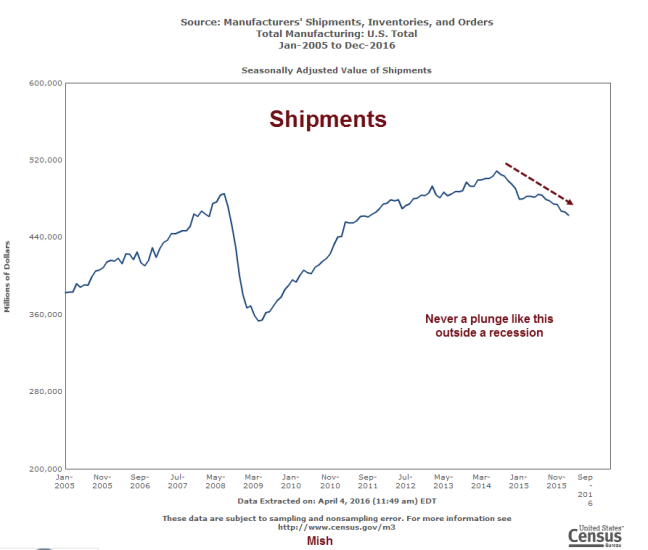
Now for a very important fact: in May actual manufacturing production declined for the first time since September, 2009. This news about output was not in the headline stories you read. The chart below looks less positive, doesn’t it?

output

You probably also didn’t see the comments from Markit’s Chief Economist Chris Williamson:

  • “The weak manufacturing PMI data cast doubt on the ability of the US economy to rebound from its disappointing start to the year in the second quarter. The survey is signalling that manufacturing will act as a drag on economic growth in the second quarter, leaving the economy once again dependent on the service sector, and consumers in particular, to sustain growth.”
  • “Output is falling for the first time since the height of the global financial crisis, with factories hit by slowing growth of order books and falling exports. Backlogs of work are also dropping at the fastest rate since the recession, meaning firms will be poised to cut capacity unless inflows of new work start to pick up again.”
  • “The survey’s employment gauge is in fact already running at a level consistent with a further reduction in the official measure of factory payroll numbers.”

If you are going to read one of these reports, you need to read the whole thing.

Wayne Wile: Fed Fantasies vs. Retail Facts

Three weeks ago I wrote that retail sales were showing real signs of weakness. Now we are seeing the results in the retail stocks and the news is even worse than I expected.

Last Wednesday, shares in Macy’s (M)—the largest department store in the U.S. and an iconic American brand—plunged 15%. The next day, department store Kohl’s (KSS) fell 9% and on Friday, high-end retailer Nordstrom (JWN) joined the bloodbath, dropping 13%. This massive selloff—which the media is calling the “Retail Wreck”—was due to terrible first-quarter results.

This is the latest bad news in what’s been an extremely ugly earnings season. Companies in the S&P 500 are on track to record a 7.1% decline in earnings. That will mark the fourth straight quarter that earnings have fallen. And that hasn’t happened since the 2008-2009 financial crisis.

Macy’s reported a 5.6% drop in its same-store sales last week. Macy’s sales decline last quarter was its biggest since 2009. Kohl’s first quarter same-store sales fell 3.9%, its biggest decline since 2009. Nordstrom did a little better, reporting “only” a 1.7% decline in same-store sales.

Yes these three are bricks-and-mortar retailers but do not be fooled; all three are also big online retailers so this is not a question of one sector growing at the expense of another. These are bad numbers, plain and simple, because the consumer is tapped out.

When I was a stock broker in a previous lifetime, we used to say that many an investor had gone broke underestimating the strength of the American consumer. The shoe is now, finally, on the other foot. Investors are going broke believing that the U.S. consumer can continue to spend.

Today we got the FOMC minutes from their last meeting two weeks ago. The minutes claim to show that the Fed governors had a serious discussion about maybe raising rates at the upcoming June meeting. At least, that’s the way the market seemed to interpret them as the fed futures contract quickly priced in a 36% chance of a hike next meeting from less than 5% last week.

I think there is no way they raise rates in June. The retail numbers are emphatic. The economy is failing before our very eyes. Don’t listen to the Fed; look at what’s happening in the real world.

Wayne Wile, More Evidence the Real U.S. Economy is in Recession

Unfortunately, most of the information we get on the U.S, economy comes from the federal government. As I have said previously, this data is so messaged by higher mathematics that it has become meaningless or misleading.

Fortunately, the private sector also produces data that does not serve a political agenda. One such source is the monthly Cass Freight Index produced by Cass Information Systems from data provided by America’s 400 largest truck and rail shippers. The most recent monthly report for April was published last Friday. Traditionally, trucking and railroad activity has been a key indicator of the health and direction of the U.S. economy.

You are about to see a chart that is undeniable evidence that we have entered a major economic slowdown.

cass

This is not a seasonally adjusted index so you can clearly see the seasonal variations in shipping activity. The red line shows the level of activity for the first four months of this year. You can also clearly see that the trend is sharply down since 2014. In fact, the first four months of this year are the worst since April of 2010. The reality is that we have now seen the Cass Index decline on a year-over-year basis for 14 consecutive months.
In 2007-2008, there was a similar decline in this Index but the Federal Reserve and other “experts” assured us that there was not going to be a recession. Then we immediately proceeded to plunge into the worst economic downturn since the Great Depression of the 1930s.

Just because stock prices are artificially high right now does not mean that the U.S. economy is in good shape.  In fact, there was a stock rally at this exact time of the year in 2008, even though the underlying economic fundamentals were rapidly deteriorating.  We all remember what happened later that year.

Wayne Wile – The Commodity Rally is Over (China Too)

So let me understand what you just told me. You said you bought back into commodities because central bank stimulus and a weaker dollar are boosting copper and oil and all that other good stuff. Have you LOST your MIND?

There is way too much capacity in commodity production thanks to far too much cheap money for far too long invested in far too big projects. There is way too little demand to absorb this supply and demand is getting weaker. The commodity super cycle has become a death spiral with the occasional bounce designed to kill off more speculators.

Crude oil has rallied enough to register technical warnings. A big swing from oversold to overbought has put lots of momentum in the play and the players couldn’t resist. May often sets a seasonal high. So far, the high has been 46.78 last Friday and Monday oil has declined to the 43 level. Production losses due to the Alberta fire popped the price to 46.06 earlier today but that didn’t last long. There is minor support at the 43 level and more at 40. Both 50 and 200 day moving averages are there. I expect those levels to break.

I don’t know how long it will take, but the 30 level in oil is looking likely. Stories about Saudis turning off the tap are – well – stories. Crude oil is suffering a massive change in technology. It is easier and cheaper to produce oil than it was 10 years ago.

Last year’s rally in base metals (GKX) made it up to the 50 week moving average and expired. That was at 345. The low was reached at 235 in January and the high since then was 278 last Tuesday, somewhat above the moving average. It seems this rally has peaked. The index has dropped to 264. Taking out support at the 262 level would suggest that 235 is likely, which makes it a full round trip.

Here’s a chart to consider…rebar…steel bars for reinforcing concrete. The price is falling out of bed today. So have iron ore futures. They were the first to break down hard after the Fed stopped Quantitative Easing in 2014. They are leading to the downside again.

steel

Wayne Wile, Employment Numbers Do Not Add Up

Finally, the monthly jobs report starts to make a little sense. Today, the much-anticipated April report from the U.S. Bureau of Labor Statistics showed a net gain of 160,000 jobs in the U.S. economy, well less than the 200,000+ expected. Goldman Sachs yesterday upped their estimate for today’s report to 245,000! Nice call.

At last, the employment data is beginning to reflect the rest of the economic data.

The problem I have with the government’s employment data is that it just doesn’t coincide with anything else. If the U.S. economy on average has really been employing an additional 200,000 people, month after month, as the government claims, why have retail sales slumped, household incomes stagnated and GDP trended down? I believe the numbers are so massaged by statistical algorithms that they no longer mean anything. And this is the report that the Fed says it relies on most for setting monetary policy.

Another odd anomaly is that the weekly initial jobless claims do not square with the layoff reports from Challenger Gray & Christmas, the ‘de-hiring’ specialists. You would think that the ongoing lay-offs in the energy and manufacturing industries, which are now on an upward trend, would result in a growing number of new claims for unemployment insurance. They don’t.

Here is the lack of agreement in visual form:

layoffs

One thing is certain: when a company announces it will lay-off thousands of employees, they do so. The economists who suggest that all is well with the U.S. labor market based on falling initial claims reports need to explain the latest report from Challenger according to which the pace of downsizing increased in April, jumping by 35% to 65,141 from the 48,207 lay-offs announced in March.

As the saying goes, if you pay someone not to understand something, they won’t. Our economics profession either works for the Fed or Wall Street so they can’t have negative views.

In the first four months of 2016, employers have announced a total of 250,061 planned job cuts, up 24% from the 201,796 job cuts tracked during the same period a year ago. This represents the highest January-April total since 2009, when the opening four months of the year saw 695,100 job cuts in the aftermath of the biggest financial crisis in modern history.

And it isn’t just energy. John A. Challenger, CEO of Challenger, Gray & Christmas, noted that “we continue to see large scale lay-offs in the energy sector, where low oil prices are driving down profits. However, we are also seeing heavy downsizing activity in other areas, such as computers and retail, where changing consumer trends are creating a lot of volatility.”

High tech, the presumed engine of growth, is cutting jobs? Yep. Computer firms announced 16,923 job cuts during the month, the highest total among all industries. That includes 12,000 from chipmaker Intel, which is shifting away from the traditional desktop and laptop market and toward the mobile market. To date, computer firms have announced 33,925 job cuts, up 262 percent from a year ago, when job cuts in the sector totaled just 9,368 through the first four months of the year.

Another prime example is IBM, where unconfirmed reports estimate as many as 14,000 layoffs in the first quarter (not included in the Challenger reports because it has not been officially announced).

How is it that these laid-off people do not apply for unemployment payments? Do they just disappear? Inquiring minds want to know.

Wayne Wile – Another Recession Indicator

As I reported earlier today, the monthly ISM Manufacturing New Orders Index is flashing recession. The March data was released on May 2 and it shows that New Orders have now declined for 17 straight months on a year-over-year basis, with March dropping 4.2% from a year ago.

Real Gross Private Domestic Investment (RGPDI) is another excellent leading indicator of recession. If businesses aren’t investing, recessions almost always follow. The latest update of this economic indicator became available last Thursday. Unfortunately, RGPDI is only reported quarterly.

As illustrated below, RGPDI turned down during the third quarter of last year. It fell a little further during the fourth quarter of last year and fell again in the first quarter of this year (the latest number), which again reinforces my belief that a recession is either underway or will soon begin.

fred

You can see the pattern in the chart as clear as day. The gray vertical lines are recessions and each one of them occurs during a downturn in business investment.

I may sound like a broken record when it comes to this recession issue. But believe me, this is important. This ridiculously over-priced equity market will be punished beyond recognition by an economic recession, presenting investors with one of the best short opportunities in many years. And the onslaught of a recession will also complete the destruction of what credibility the Fed has left, opening the way for the mother of all gold rallies.

Wayne Wile, After Houses and Cars, What’s Left?

As I wrote back on March 26, there is no better indicator of the health of the US economy than housing. Not that it should be so important. But America is a consumer society and housing is the biggest ticket item there is for most people.

On March 21, we got the existing home sales data for February. Demand for housing shocked to the downside. Existing home sales fell 7.1% with all segments of the market showing weakness. Median prices fell 1.4%. Econoday noted that the numbers were “much lower than expected.”

Well, there is one other asset just as important to the US economy as houses…cars. And cars are now looking sick. Something is not right in auto-land. Inventory is rising rapidly and the all-important inventory-to-sales ratio is verging on panic territory. Obviously, the manufacturers have been stuffing the wholesale channel to get their sales up. Now, they are going to pay the price. If you know a car dealer personally, consider rounding up his guns before he does something stupid.

Inventories at the wholesale level are the worst we have seen since the Great Recession. Here’s the 25 year seasonally-adjusted chart of wholesale inventories for the month of February from Jeffrey Snider of Alhambra Partners:

Wholesale

The inventory problem is the direct result of a serious setback in overall motor vehicle sales. Surplus inventory is not going to be solved by increased sales which are actually tanking (see chart below).

Total Vehicle

What’s even more concerning is that vehicles have been about the only bright spot in an otherwise depressed US manufacturing sector. Peaking in October and November at a seasonally adjusted annual rate of 18.6 million units, sales have dropped by an astounding 9% to just 16.9 million in March, with sales falling 1 million units in March alone. As these numbers filter into the data on industrial production and durable goods, markets are going to be shocked.

Vehicle and housing sales are the key factors to watch now. They are clearly signalling a US recession dead ahead. When the market figures that out, you will not want to be holding US equities.

Wayne Wile, Jobs: Quality means more than quantity

Political commentators seem unable to understand why Bernie Saunders and Donald Trump have managed to tap into such rage among average American voters. The talking heads just assume the headline economic numbers reported by Wall Street are real. The economy is fine and getting finer, right? Wrong, and Americans know it.

One of the great lies is in the monthly jobs report. It’s not that the headline numbers are made up. The problem is what the numbers don’t tell you…that the new jobs are mostly not good jobs. That is why household incomes are not growing, average families are slipping behind in their bills and people are getting frustrated and angry. It’s a problem of quality.

Since March 2011 — five years ago — the U.S. economy has added 12.4 million jobs. Here’s where two-thirds of them can be found:

  • 2.2 million in “leisure and hospitality,” including 1.8 million in “accommodation and food services”
  • 2.6 million in “education and health services,” including 2.1 million in “health care and social assistance”
  • 1.4 million in “retail trade,” including 300,000 in car dealerships and 260,000 in “food and beverage stores”
  • 1.3 million in ‘”administrative and waste services”

In the main, these are not good-paying jobs. To raise a family, you may need at least two of them, and many workers have more than one job. They are offsetting quality with quantity.

Where do the people taking these jobs come from? Often, from better paying jobs such as in manufacturing where the layoffs continue.

As shown in the chart below, in the past month 29,000 manufacturing jobs were lost. This was the single biggest monthly drop in the series going back to December 2009.

monthly change

As the predominance of red over green clearly shows, the manufacturing jobs lost in the Great Recession have not come back. And since the start of 2015, 24,000 manufacturing jobs have been lost compared to an increase of 365,000 food service workers. If Americans did not eat out every day, many of them wouldn’t be working either.

Last month, nearly every laid-off manufacturing worker seems to have found a job as a waiter. In March, workers in the “Food services and drinking places” category, waiters– bartenders and cooks– rose to a new record of 11,307,000 workers, an increase of 25,000 in the month, just about offsetting all the lost manufacturing jobs.

Here’s the chart:

Waiter

If I went from earning $25 an hour in manufacturing to a minimum wage job at the local diner, I would be voting for Trump too.

Chart Source: zerohedge.com

Wayne Wile; Q1 GDP Expectations Continue to Sink

Readers will be familiar with the GDPNow estimates published regularly by the Atlanta Federal Reserve. These estimates have been the most accurate out there, quarter after quarter. The latest forecast for Q1 GDP is just 0.4%, despite the most benign winter weather in decades.

You may remember that the “polar vortex” phenomenon was said to have been the reason for lower GDP in Q1 of 2014 and even 2015. This year, you can expect that the unseasonal warmer weather will be the excuse for poor growth because it has suppressed parka sales and home heating and utility revenues. You heard it here first.

This latest markdown in GDPNow estimates for Q1 reflects another set of weak economic reports. If you are keeping score at home, here are the reports the Fed says are responsible for taking down their forecast from just under 2% on March 15 to 0.4% today:

  • On March 21, existing home sales plunged a surprising 7.1%.
  • On March 23, new home sales showed a distinct lack of momentum.
  • On March 24, durable goods order fell 2.8%, much more than expected.
  • On March 28, a surprisingly weak household income report signalled weaker consumer sales on the way.
  • On April 4, factory orders fell 1.7% and capital goods orders surprised to the downside by 2.5%.
  • On April 5, the trade deficit unexpectedly widened.

The result of this run of terrible data is clearly evident in the chart below:

Evolution of Atlanta Fed

Wake up and smell the recession, people. This is no time to buy the S&Ps.

Wayne Wile, Capital Goods: Another Sign of Weakness

Every time the U.S. economy burps up a slightly better number, the bulls do a little dance and declare an end to the current weakness. The recovery is back, they say. They have been doing this routine for seven years now. But every time, the next number to come out is down and their hopes are squashed. I marvel at their resilience.

The latest example is the February Factory Orders report from the U.S. Census Bureau. Factory Orders for January were originally reported as up 1.6%. The period of manufacturing weakness is over, said the bulls. But today’s release of the February numbers took it all away. January was revised down to a gain of 1.2% while February recorded a drop of 1.7%. Net-net, the decline continues.

Here’s the evidence:

Wayne Wile

As you can see, the ship is sinking. There is no recovery here.

What’s worse is the capital goods component of the report. Leaving out defense spending and aircraft orders, the Durable Goods report provides valuable insight into capital spending. Orders for Core Capital Goods fell 2.5 percent in February, pointing to continuing trouble for business investment. Core Capital Goods were down year-over year for the 12th consecutive month. The last positive reading was for January 2015. Month-over-month, shipments fell for 8 straight months.

How can you have an economic recovery without business investment?

One of the narratives you here from the bulls is that we can have a manufacturing recession without a recession in the economy as a whole. Really? Look at this chart and tell me we aren’t heading toward a 2008-style recession all over again.

Shipments

Chart Source: Mishtalk.com